Beyond Tariffs Strategic Realignment in Australia–India Trade and Investment

Australia and India Advancing Bilateral Trade
1. Historical View
Australia and India established the Joint Ministerial Commission (JMC) in 1989 to facilitate governmental and business-level discussions on trade and investment. However, bilateral trade remained relatively limited for many years, primarily centered around Australia's coal, gold, and natural gas exports. In 2019, the total trade between the two nations was valued at approximately $18.9 billion, accounting for just 2.7% of Australia's total trade.
The relationship gained momentum in 2009 when it was elevated to a "Strategic Partnership," and further advanced to a "Comprehensive Strategic Partnership" in 2020. This progression marked a commitment to deeper collaboration across various sectors, including defense, energy, and trade.
India's Ascendancy and Australia’s Strategic Shift

Chart 1: Australia Exports to India; Source: Trading Economics, May 2025
India has rapidly emerged as one of Australia’s most dynamic export destinations. Between 2020 and 2024, bilateral trade surged from under $10 billion to over $16 billion, driven by growing Indian demand for Australian coal, agricultural commodities, education services, and critical minerals. While trade with traditional partners like China shows signs of moderation, the trajectory with India reflects sustained momentum and economic complementarity.
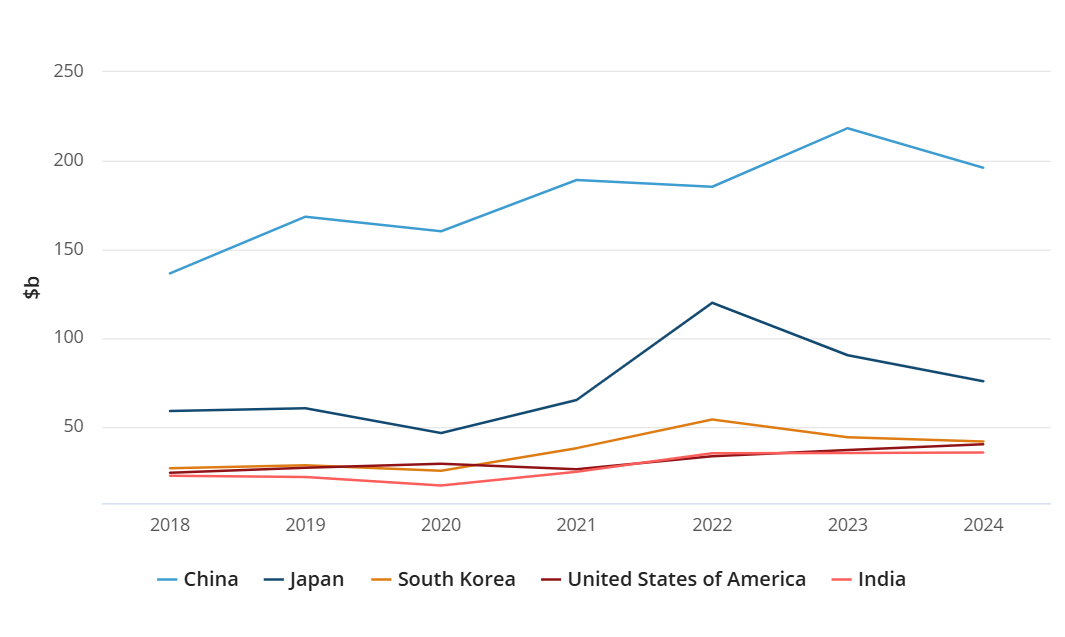
Chart 2: International Trade, Source: Australian Bureau of Statistics (2024), 29 April 2025
Chart 2 highlights how India, though still behind China, Japan, and South Korea in total export value, has shown one of the most consistent growth trajectories since 2020. From under $20 billion in 2018, exports to India have steadily increased, approaching $35 billion in 2024, nearly closing the gap with traditional partners like South Korea and the United States.
Australia’s exports to China, while still the largest (peaking at nearly $190 billion in 2023), have shown signs of moderation in 2024. In contrast, India’s trade relationship with Australia appears to be accelerating, driven by complementary economic needs and ongoing bilateral agreements such as the Australia-India Economic Cooperation and Trade Agreement (AI-ECTA).
This shift signals that India is not only a strategic market for traditional exports like coal and food products but also a growing destination for technology, education, and critical mineral exports, making it a cornerstone of Australia’s future trade strategy in the Indo-Pacific region.
In February 2025, India exported $808M and imported $929M from Australia, resulting in a negative trade balance of $121M. Between February 2024 and February 2025 the exports of India increased by $339M (74%) from $469M to $808M, while imports decreases by $177M (16%) from $1.11B to $929M.
India now stands as Australia’s 8th largest trading partner, with total trade reaching A$48.5 billion in 2025 (refer to Table 1). This growth has been driven by a more liberalized trade environment under the Australia–India Economic Cooperation and Trade Agreement (AI-ECTA), which took effect in December 2022.
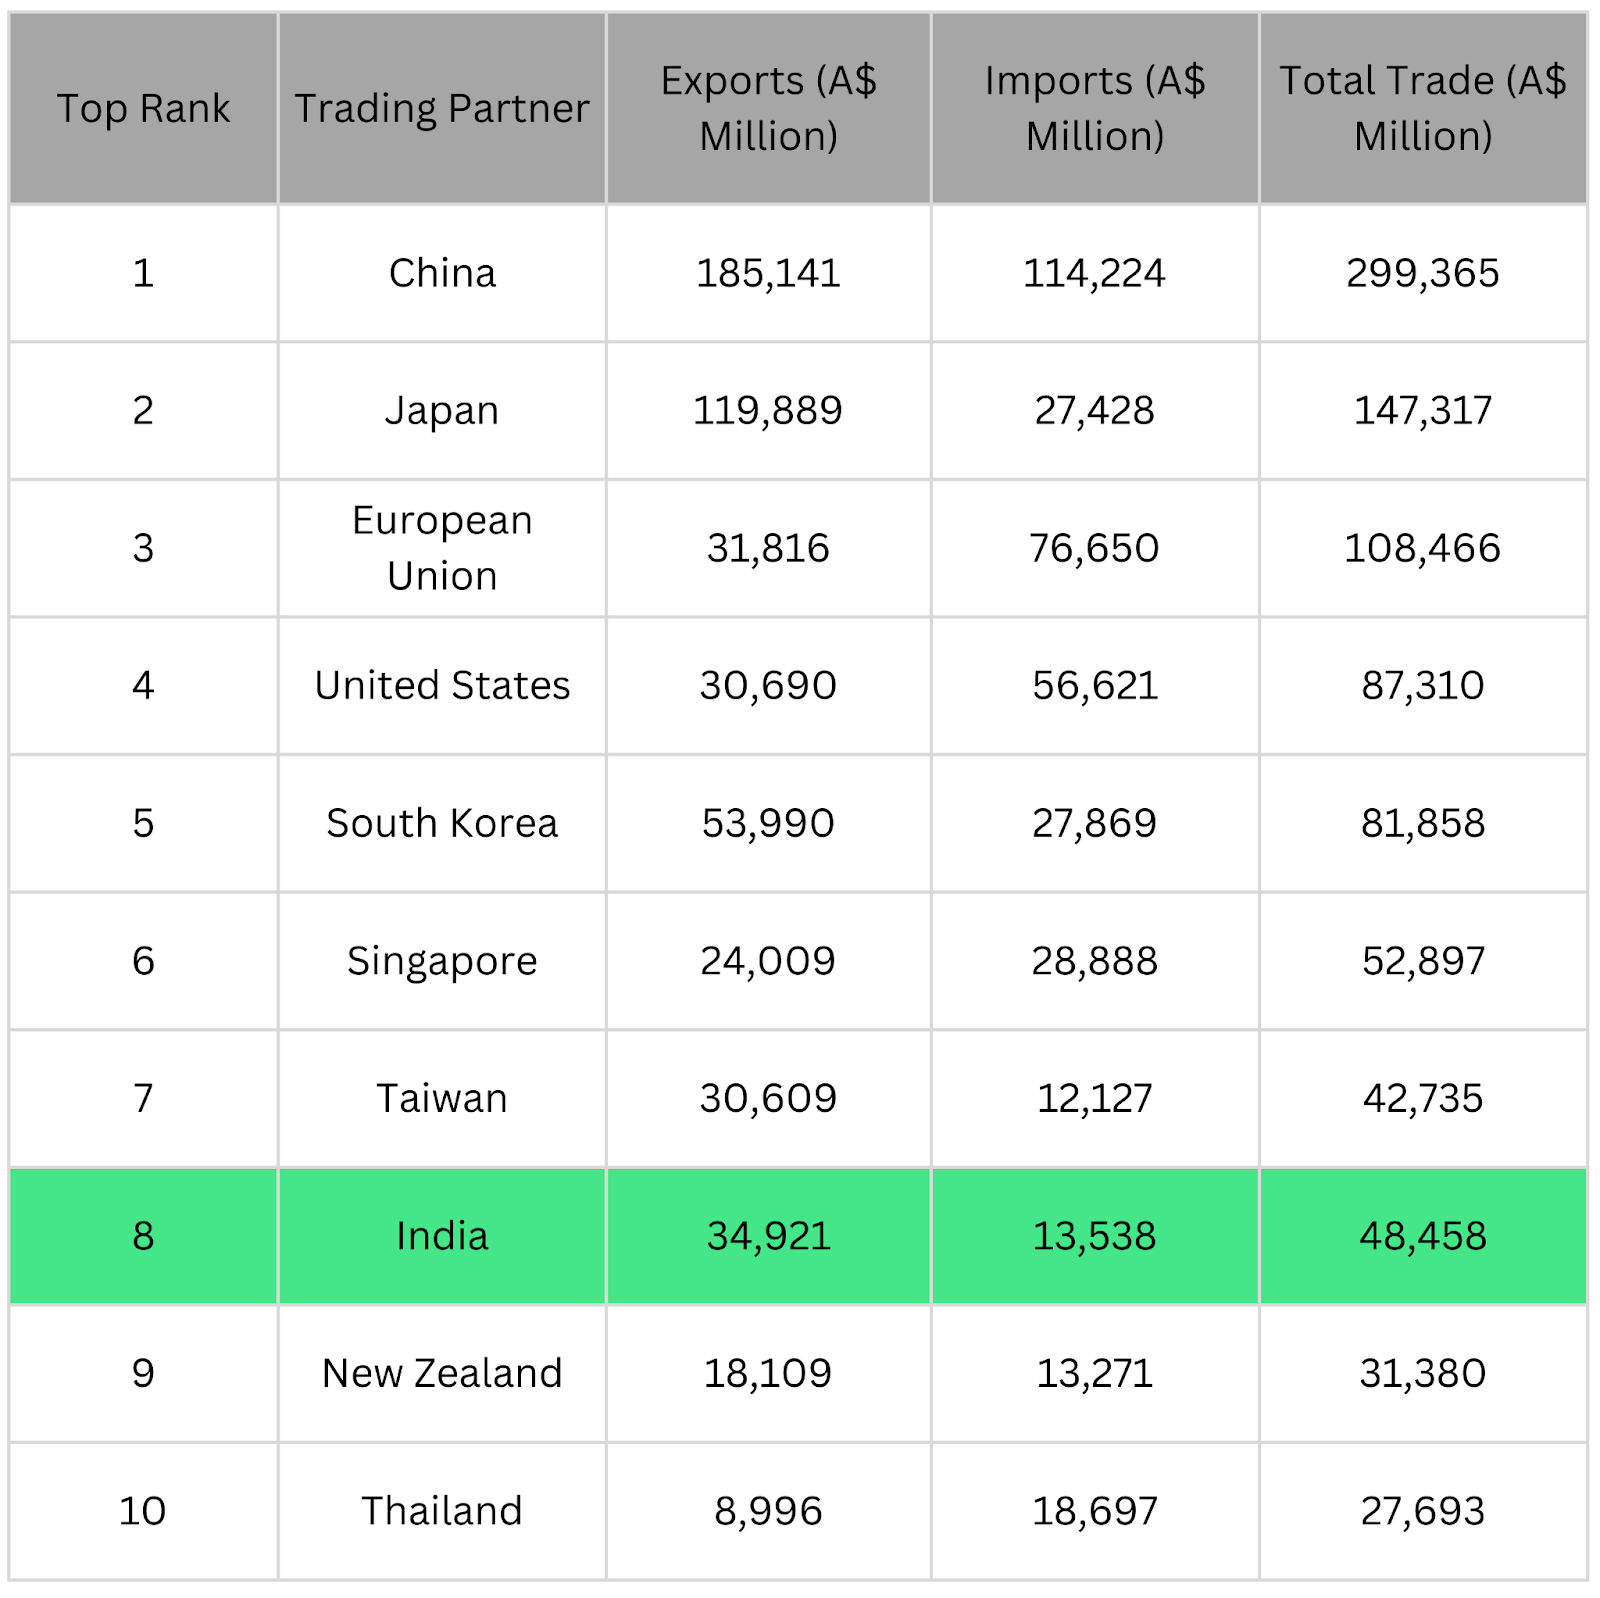
Table 1: Australia's Top Trading Partners in 2025; Source: Seair, 16 April 2025
Under this agreement, over 85% of Australian goods exported to India are now tariff-free, and this figure is set to increase to 90% by January 2026. Tariffs on key agricultural exports have also been lowered. Reciprocally, 96% of Indian imports into Australia are already tariff-free, with a full phase-out of tariffs expected by 2026. This liberalised trade environment is enabling stronger two-way flows and setting the stage for deeper sectoral collaboration.
Australia’s trade shift toward India reflects not just opportunity, but long-term strategic alignment, particularly in sectors like agriculture, energy, education, and digital services.
2. Where are Trades Flowing
a. Education & EdTech
Education has emerged as one of Australia’s top income-generating exports, ranking fourth after key commodities like coal and iron ore. This reflects the sector’s growing significance, not just economically but also diplomatically.

Chart 3: Australia’s Top Five Exports, Goods, and Services (A$ Million); Source: Australian Government, 9 January 2025
India is currently the second-largest recipient of Australian education exports, behind China, and is rapidly closing the gap. Education export income from India has steadily increased across recent years, highlighting the country’s expanding demand for Australian education services.
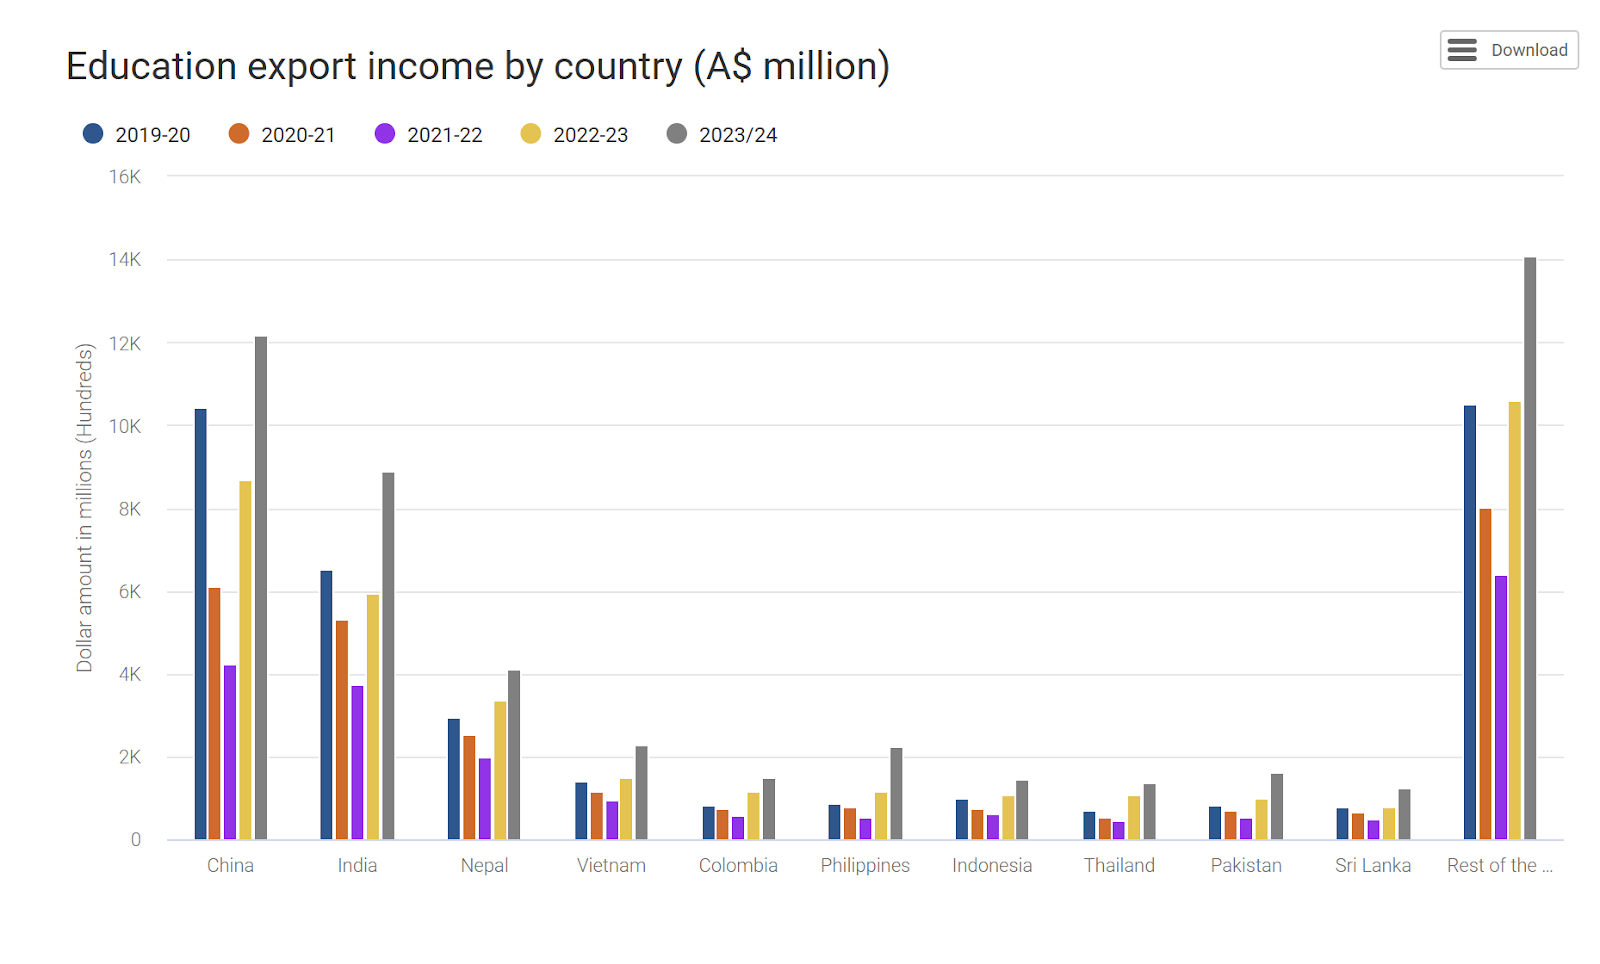
Chart 4: Education Export Income by Country (A$ Million); Source: Australian Government, 9 January 2025
This growth signals a powerful synergy between the two nations. With Australia’s globally recognized education system and India’s burgeoning youth population and appetite for digital learning, there is a strong opportunity to deepen collaboration, particularly in tertiary education, vocational training, and EdTech solutions such as online certification and skills development platforms.
b. Clean Tech
Beyond trade mechanics, India is rapidly emerging as Australia’s most climate-aligned growth partner.

Table 2: Australia’s Top 10 Export Markets and Their Renewable Energy and Net Zero Target; Source: Accenture, October 2021
For Australian companies in clean energy, India is not only a growth market but a climate-aligned trade partner at the heart of Australia’s Indo-Pacific strategy.
While countries like Japan, the U.S., and South Korea have strong net-zero commitments, India’s renewable energy target of 60% by 2030 stands out as the most ambitious among Australia’s top 10 export markets, and it’s translating directly into economic activity.
c. Seafood Industry
Australia has emerged as the leading supplier of fresh and chilled salmon to India, overtaking Norway’s long-standing dominance in this category. This shift marks a significant milestone for Australian seafood exports, particularly premium Tasmanian salmon.
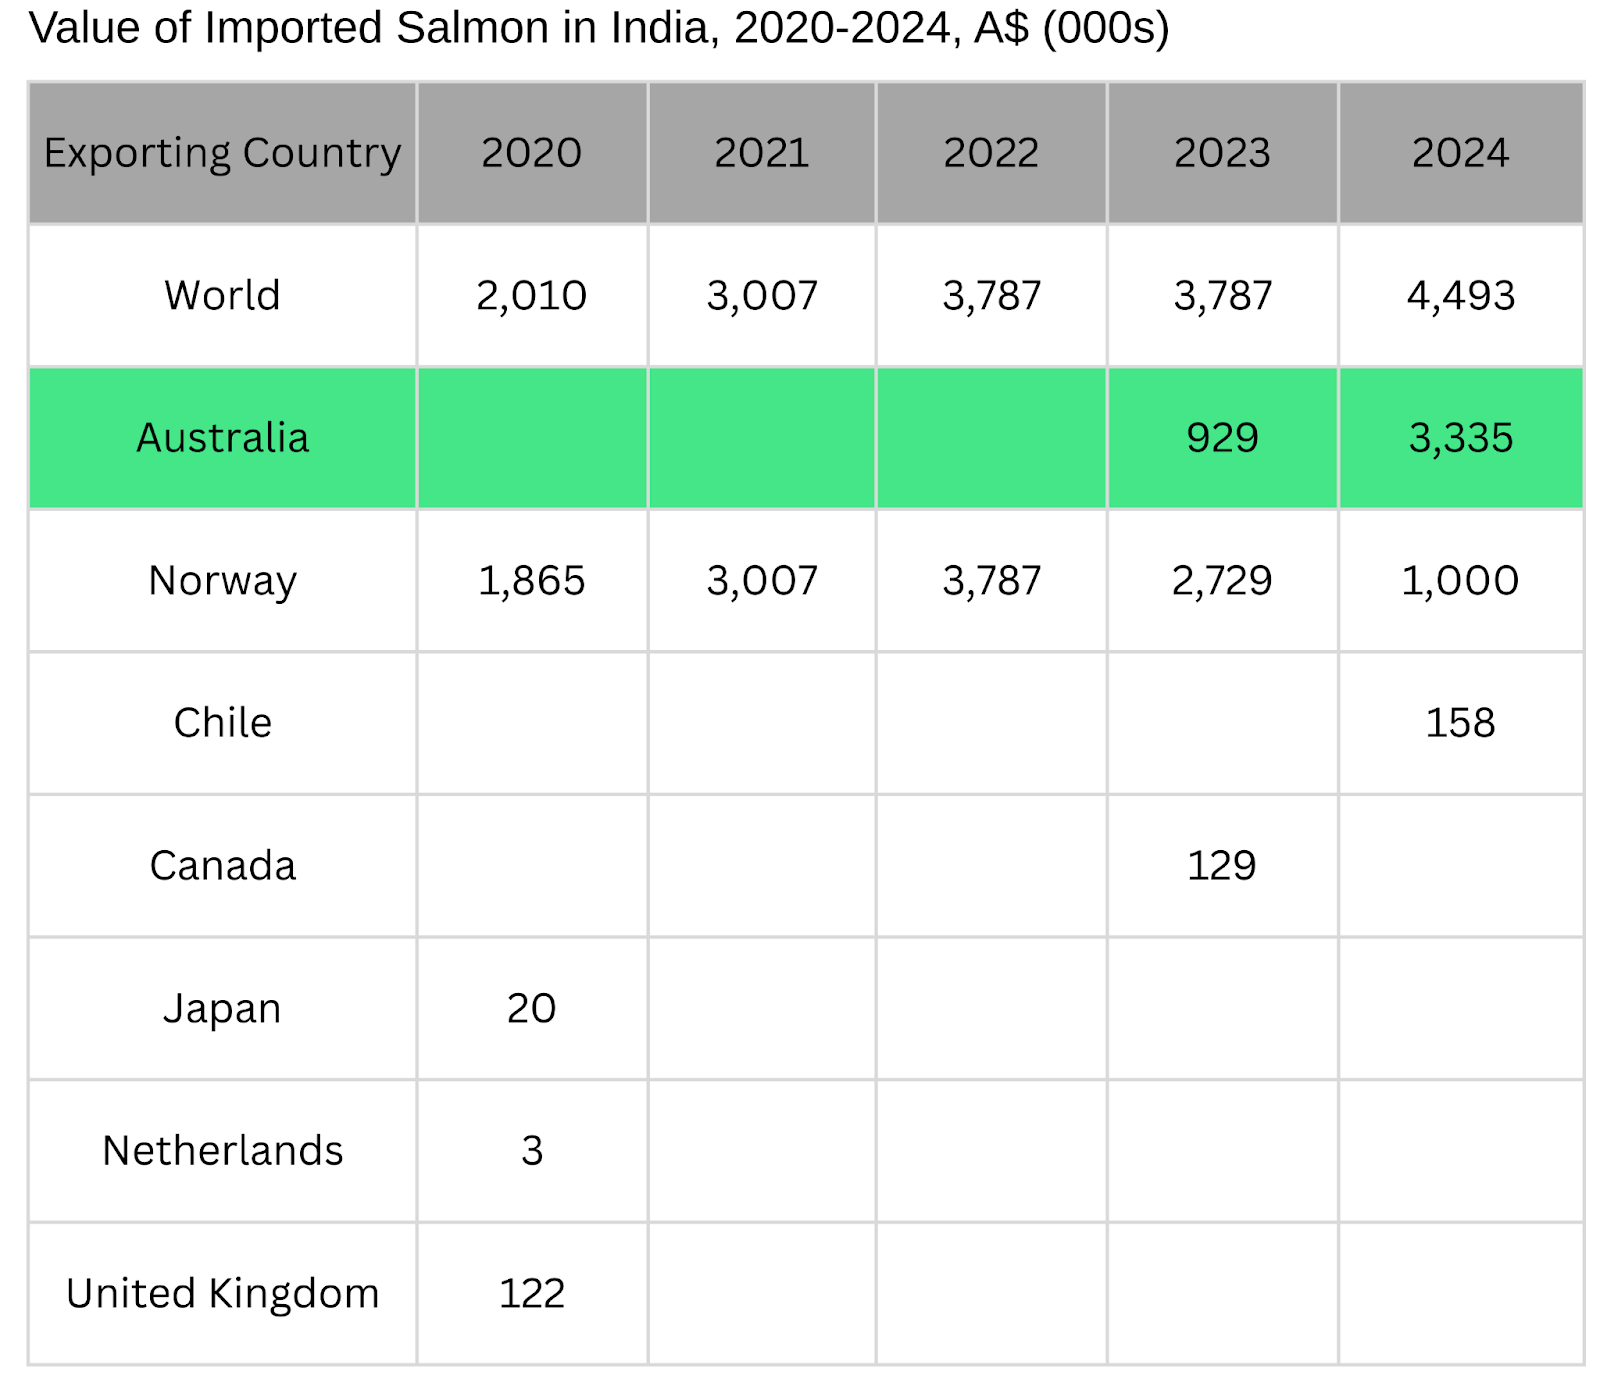
Table 3: Value of Imported Salmon in India, 2020-2024, A$ (000s); Source: Australian Trade and Investment Commission, 15 May 2025
In 2024, Australian producers secured a 75% share of India’s fresh whole Atlantic salmon imports, a sharp increase from 25% in 2023. At the same time, Norway’s export volumes to India plummeted from 161 tonnes to just 65 tonnes.
Driven by rising demand for high-quality seafood, India’s total salmon imports increased by 82 tonnes, reflecting a 37.4% year-on-year growth. This surge underscores the growing appetite in India for premium seafood and highlights the expanding role of Australia in meeting this demand.
The evolving trade dynamics between Australia and India reflect a deepening economic partnership built on shared priorities and complementary strengths. From education and digital learning to clean energy and premium food exports, Australia is aligning with India’s rising demand and strategic goals. As India continues to grow as a major global economy, Australia’s targeted focus on sectors like EdTech, renewable energy, and high-value agriculture puts Australia in a strategic partnership position in India’s development journey. These trends signal not just trade growth but a broader opportunity for long-term collaboration rooted in innovation, sustainability, and mutual benefit.
Comparative Growth Trends Between India and China
1. Why India’s Rise Isn’t Just a Hedge
While the 90-day U.S.–China tariff pause has eased short-term tensions, the deeper structural realignment in global trade continues. Australia’s pivot toward India is not simply a diversification strategy but a long-term repositioning grounded in economic performance and stability.
Latest GDP data reinforces this shift. As of Q4 2024, India and China both posted quarterly GDP growth of 1.6%, while Australia trailed at 0.6%. This performance gap highlights India’s sustained momentum and its potential as a dependable economic partner.
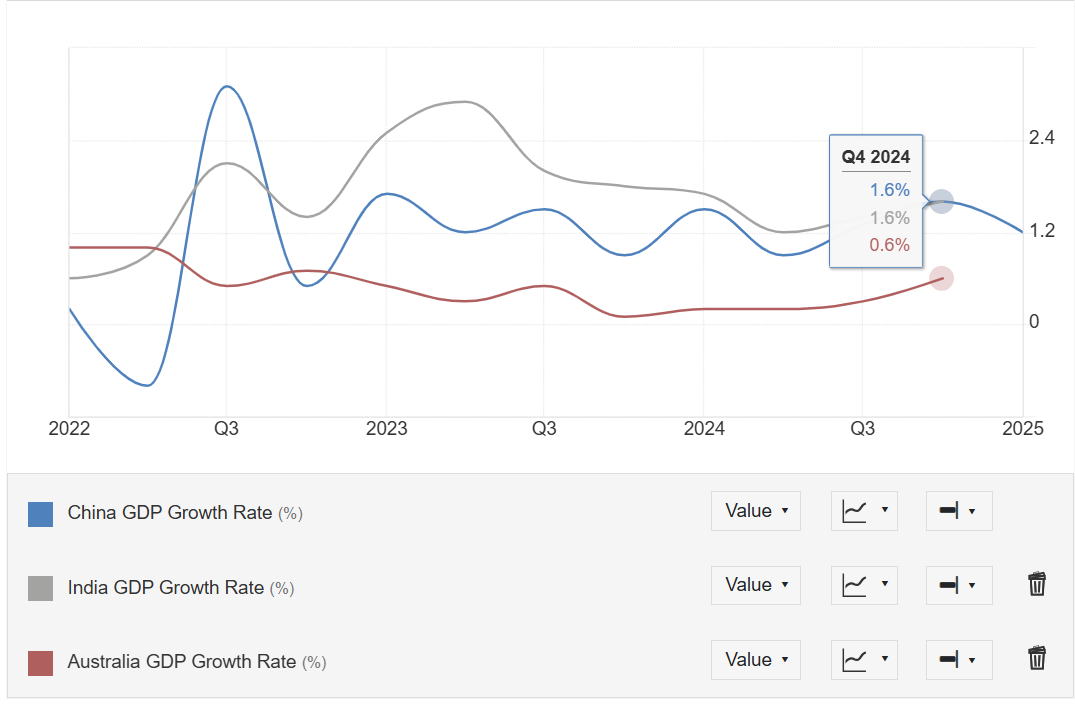
Chart 5: China vs. India vs. Australia GDP Growth Rate; Source: Trading Economics, May 2025
In this context, India is emerging not just as a secondary option but as a strategic anchor in Australia’s Indo-Pacific engagement, offering resilience, scale, and long-term complementarity.
2. Inflation Outlook: India vs China
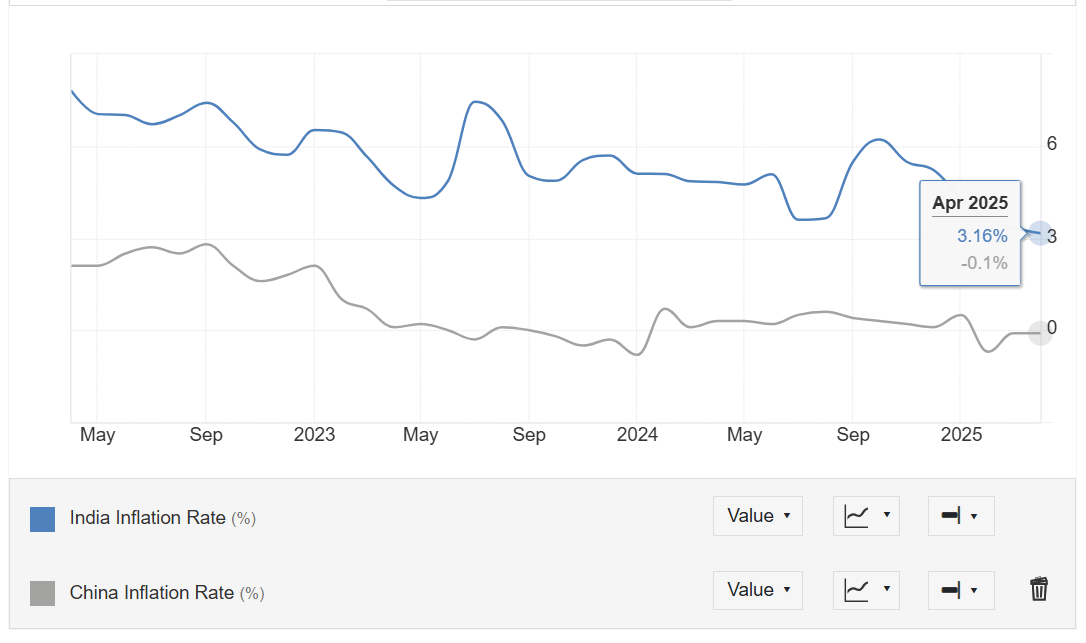
Chart 6: China vs. India Inflation Rate; Source: Trading Economics, May 2025
China’s inflation rate dipped slightly to -0.1% in April 2025, suggesting persistent deflationary pressures and subdued domestic demand. While the Chinese market still holds long-term potential, current economic signals point to structural challenges that may limit near-term momentum.
Meanwhile, India’s inflation rate remains steady at 3.16%, reflecting resilient consumer demand and stable economic growth. This consistent performance enhances India’s appeal as a strategic trade partner for Australia, offering both market dynamism and policy stability in a shifting global trade landscape.
India Maintains Economic Leadership
1. Economic Growth Rate
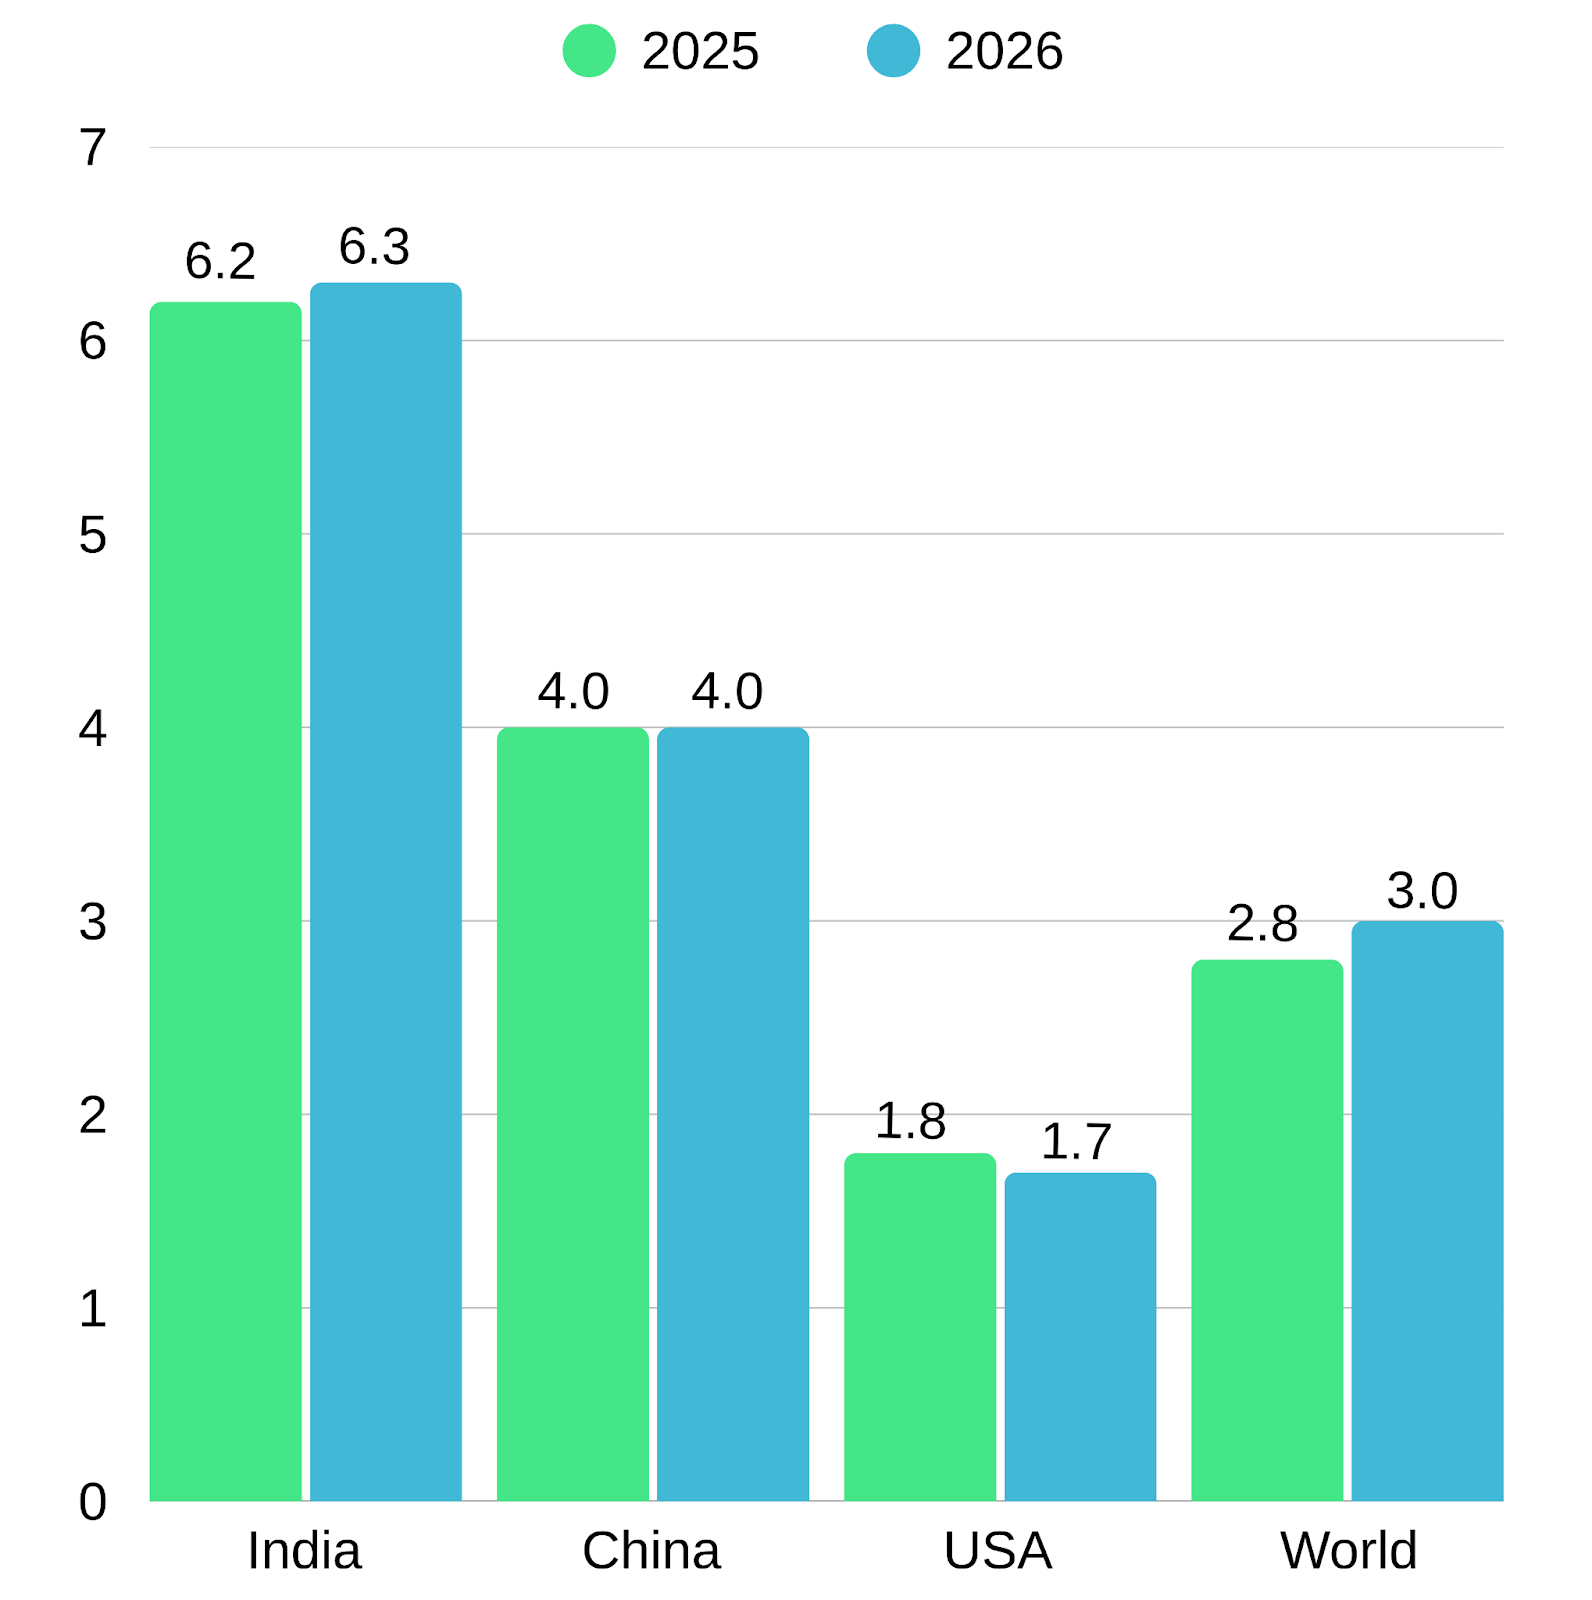
Chart 7: Global Economic Growth Rate (2025-2026); Source: IMF World Economic Outlook, April 2025
India is projected to remain the fastest-growing major economy over the next two years, further solidifying its role as a critical player in the global economic landscape. According to the IMF World Economic Outlook (April 2025), India’s GDP is expected to grow by 6.2% in 2025 and 6.3% in 2026, significantly outpacing the global average of 2.8% and 3.0%, respectively.
In contrast, China’s growth forecast has been revised downward to 4.0% for both years, highlighting the relative strength and consistency of India’s outlook. This growth is underpinned by resilient domestic demand, expanding infrastructure, and a rapidly advancing digital economy.
2. Stock market valuations

Chart 8: Current PE Ratios for various Main Stock Exchanges; Source: FactSet, MSCI, Standard & Poor’s, J.P. Morgan Asset Management, Guide to the Markets – Australia, 16 May 2025
India’s equity market currently trades at a P/E ratio of 22.4, placing it above the global average of 19.1, and ahead of Australia (18.4) and China (11.4).
While India’s valuation premium suggests a more optimistic pricing of future earnings, it also signals a degree of confidence in the country’s underlying fundamentals, including consistent GDP growth, digital expansion, and a broadening investor base.
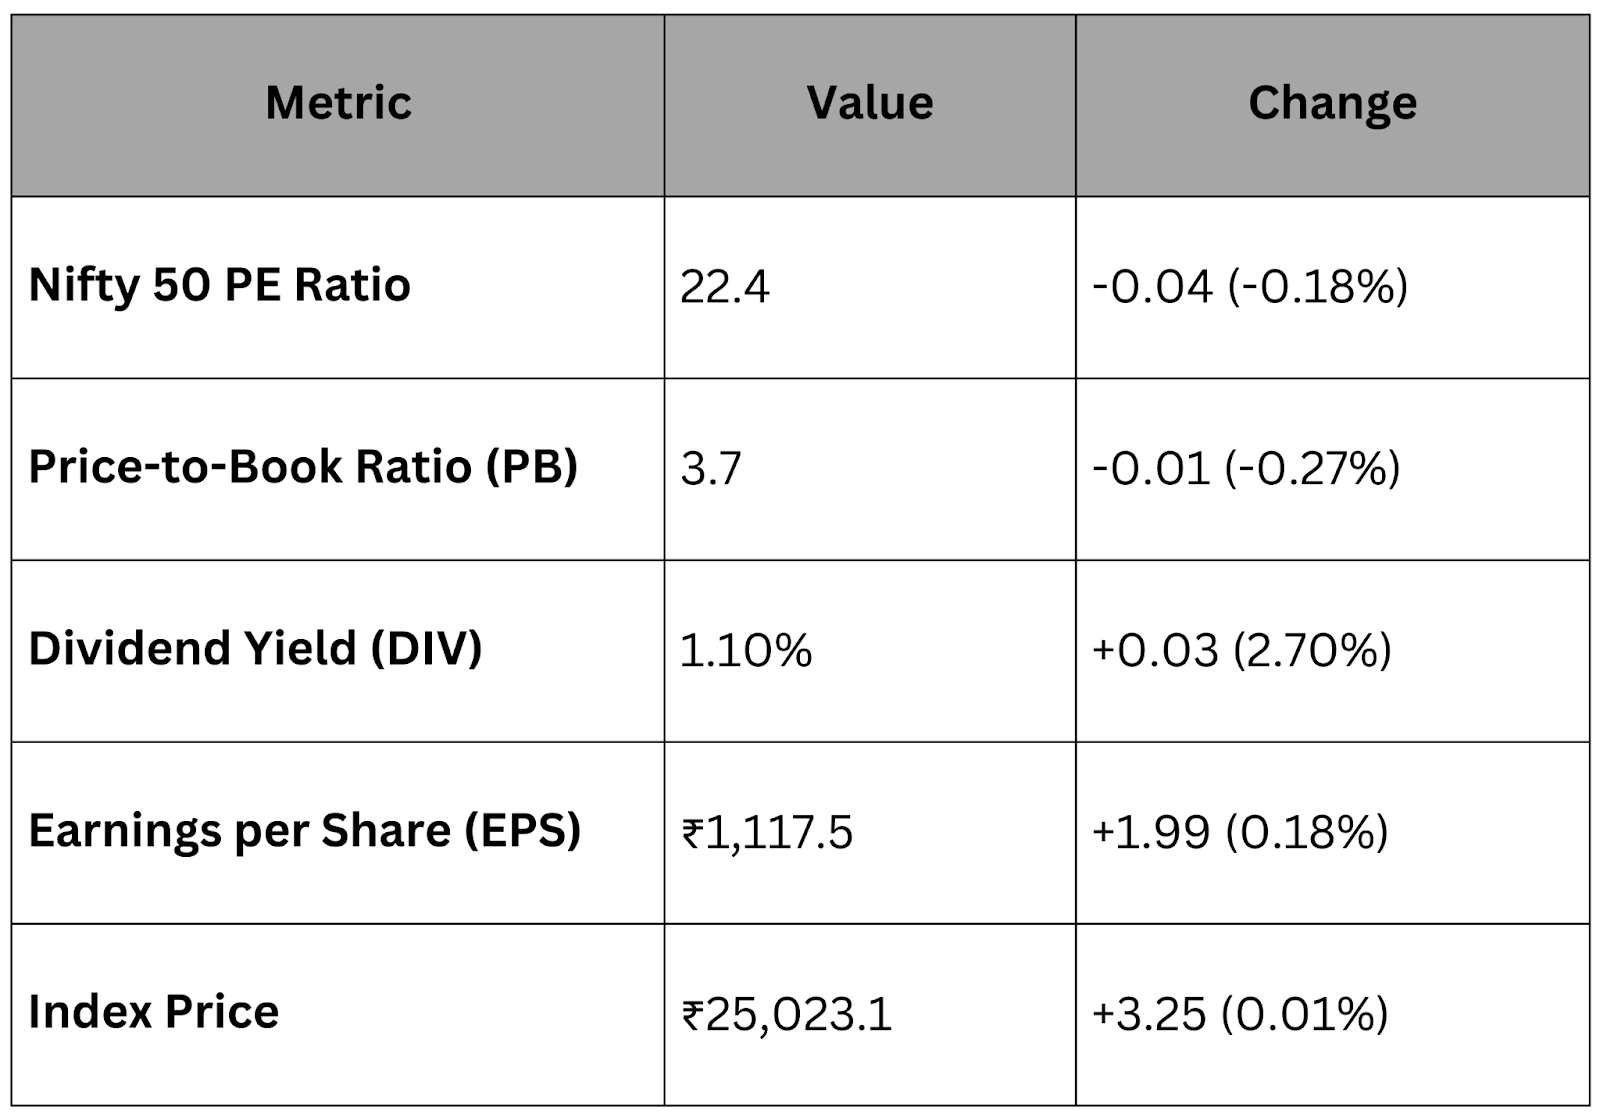
Table 4: Nifty 50 and CSI 300 Performance Metrics; Trendlyne; Bloomberg, 16 May 2025
As of 16 May 2025, the Nifty 50 index was trading at a price-to-earnings (PE) ratio of 22.4, placing it near the upper bound of its 20-year historical average. This elevated valuation reflects investor confidence in India's structural growth drivers, including its favorable demographics, expanding middle class, and dynamic corporate earnings landscape.
In comparison, China’s CSI 300 index traded at a PE ratio of 12.9, with a lower price-to-book ratio of 1.5 and a relatively higher dividend yield of 2.3%. These figures suggest more conservative valuations, likely influenced by macroeconomic headwinds and a moderated growth outlook in the Chinese market.
Earnings growth has been a key differentiator. The Nifty 50’s earnings per share (EPS) rose from approximately ₹842.7 in May 2022 to ₹1,117.5 in May 2025, representing a cumulative growth of over 32% in three years. This sustained performance underpins the index’s strong price appreciation and signals continued resilience in India’s corporate sector.
3. Stock market performances
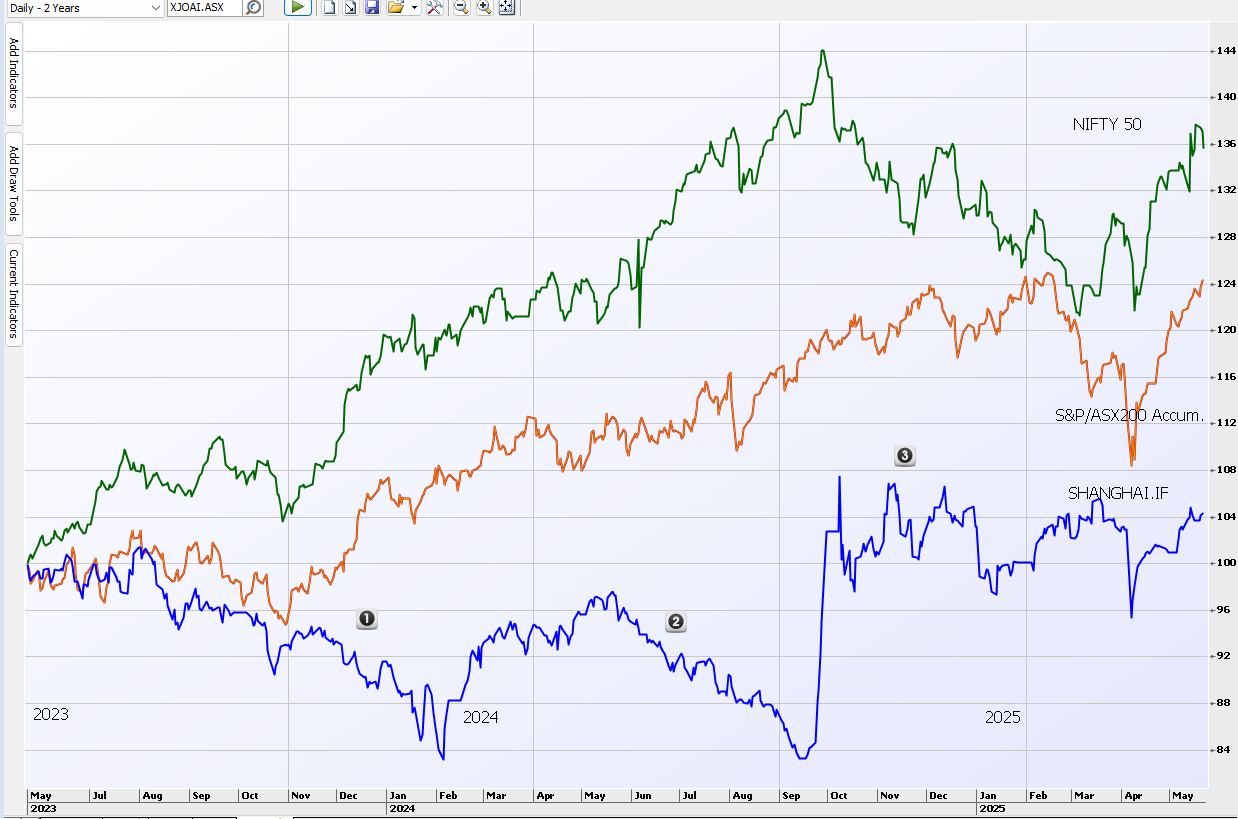
Chart 9: Performances of Nifty 50 Index, S&P/ASX200 Accumulation Index vs CSI300 Index; Source: IRESS, 22 May 2025
As of 22 May 2025, equity market performance across major Asia-Pacific indices reflects distinct divergence in investor positioning and macroeconomic fundamentals. Over the past 24 months, the Nifty 50 Index has meaningfully outperformed both the S&P/ASX200 Accumulation Index and China’s CSI300, as shown in Chart 9. This performance trend is consistent with India’s strong economic outlook, rising earnings momentum, and supportive market reforms.
Valuation differentials further support this narrative. India trades at a premium, reflecting growth expectations, while China continues to price at a discount, offering relative value amid broader structural recalibration. This divergence presents a compelling growth-versus-value allocation consideration within emerging market portfolios.
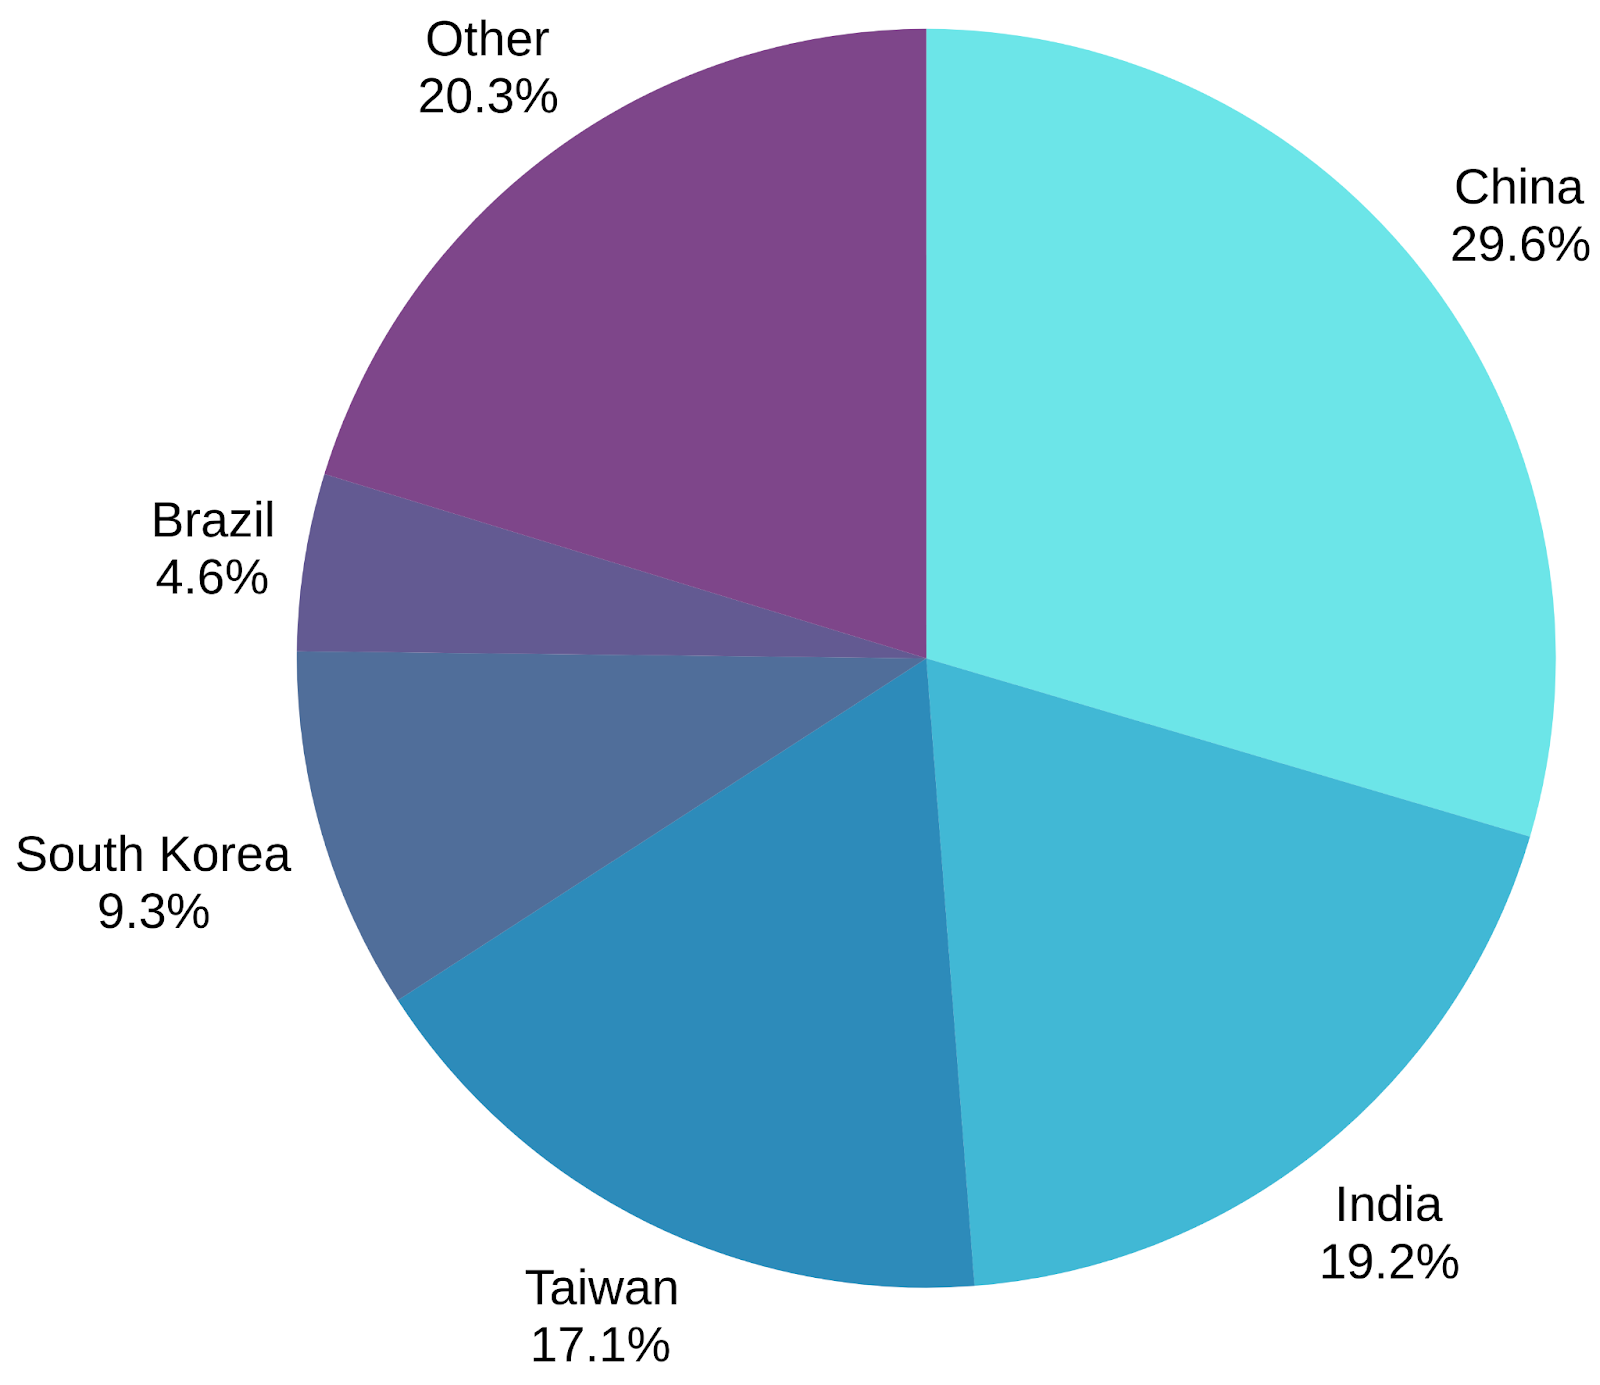
Chart 10: Country Weights MSCI Emerging Markets Index (USD); Source: MSCI, 30 April 2025
These dynamics are also visible in MSCI Emerging Markets Index allocations (Chart 10), where China remains the largest constituent (29.6%), followed by India (19.2%) and Taiwan (17.1%). India’s rising index weight signals increasing institutional confidence and structural inclusion in global asset allocation frameworks.
Rather than viewing India and China as binary investment choices, asset allocators may benefit from a blended approach, leveraging their contrasting risk-return profiles. Historical index behavior illustrates that India and China have exhibited differentiated performance cycles, creating potential for natural hedging within a broader EM strategy. This supports the case for multi-country exposure, particularly when navigating cyclical dispersion and policy-driven volatility in Asia.
Conclusion
The trajectory of Australia–India trade reflects a broader trend of realignment in response to changing global dynamics. While short-term developments, such as the temporary pause in U.S.–China tariffs, can shift sentiment, long-term strategies are increasingly influenced by structural economic indicators, sectoral complementarities, and market stability.
India’s steady growth outlook, expanding consumer base, and rising weight in global investment indices highlight its increasing relevance in regional and international trade. For Australia, engagement with India continues to expand across multiple sectors, supported by formal trade agreements and aligned economic interests.
As global trade relationships evolve, the Australia–India partnership illustrates how diversification strategies are progressing into deeper, more structured economic collaborations. Continued monitoring of trade flows, macroeconomic indicators, and capital market movements will be essential in assessing how this alignment develops in the years ahead.
References
- Australian Bureau of Statistics. (n.d.). International trade: Supplementary information, calendar year. https://www.abs.gov.au/statistics/economy/international-trade/international-trade-supplementary-information-calendar-year/latest-release Accessed May 21, 2025.
- Australian Council of Trade Unions. (2023, August). Clean exports: Detailed report. https://www.actu.org.au/wp-content/uploads/2023/08/clean-exports_detailed_report_vf.pdf Accessed May 20, 2025.
- Australian Government Department of Education. (n.d.). Education export income—Financial year. https://www.education.gov.au/international-education-data-and-research/education-export-income-financial-year Accessed May 21, 2025.
- Australian Government Department of Foreign Affairs and Trade. (n.d.). Australia-India Economic Cooperation and Trade Agreement (AI-ECTA). https://www.dfat.gov.au/trade/agreements/in-force/australia-india-ecta Accessed May 20, 2025.
- Australian Trade and Investment Commission. (n.d.). Aussie salmon spawns export success in India. https://www.austrade.gov.au/en/news-and-analysis/news/aussie-salmon-spawns-export-success-in-india Accessed May 19, 2025.
- High Commission of India, Canberra. (n.d.). India-Australia relations. https://hcicanberra.gov.in/page/india-australia-relations/ Accessed May 20, 2025.
- India Briefing. (2024, March 14). India-Australia bilateral trade and investment profile. https://www.india-briefing.com/news/india-australia-bilateral-trade-and-investment-profile-34621.html/ Accessed May 19, 2025.
- Office of the United States Trade Representative. (2025, May). Joint statement on U.S.–China economic and trade meeting in Geneva. The White House. https://www.whitehouse.gov/briefings-statements/2025/05/joint-statement-on-u-s-china-economic-and-trade-meeting-in-geneva/ Accessed May 21, 2025.
- Seair Exim Solutions. (n.d.). Biggest export of Australia. https://www.seair.co.in/blog/biggest-export-of-australia.aspx Accessed May 19, 2025.
- The Australian Industry Group. (2024). The burgeoning Australia–India trade relationship. https://www.aigroup.com.au/resourcecentre/research-economics/economics-intelligence/2024/the-burgeoning-australia-India-trade-relationship/ Accessed May 20, 2025.
- Trading Economics. (n.d.). Australia exports to India. https://tradingeconomics.com/australia/exports/india Accessed May 21, 2025.
- Trading Economics. (n.d.). China GDP growth. https://tradingeconomics.com/china/gdp-growth Accessed May 19, 2025.
- The Observatory of Economic Complexity (OEC). (n.d.). India (IND) and Australia (AUS): Bilateral trade. https://oec.world/en/profile/bilateral-country/ind/partner/aus Accessed May 20, 2025.